EIA oil & gas productivity report: Is it all downhill from here?
From an Article by Marissa Hall, Shale Plays Media, June 10, 2015
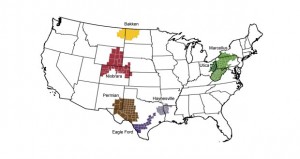
Although the U.S. shale revolution has maintained impressive momentum over the course of the last year, depressed oil prices have taken their toll. The Energy Information Administration released its monthly drilling productivity report this week, and it has confirmed what many industry experts saw coming. With the exception of the Permian Basin, the U.S. has seen a drop in oil and gas production across the board in the major shale regions.
According to Oilprice, the major shale plays in the U.S. will have decreased a projected 208,782 barrels of oil per day (bpd) by July, down from April’s peak of 5,694,580 bpd as production decreases took root shale by shale. Now, the last holdout is the Permian, where production has yet to decrease but has seriously “plateaued” (leveled).
The biggest factor in the downward trend is the decrease in legacy oil production, which the EIA report asserts is largely due to well depletion rates.
The nation’s strongest areas saw the most troubling declines. The Bakken decreased 29,000 bpd from the previous month. The area’s peak point was at 1,311,703 bpd in March but will have decreased roughly 74,763 bpd by July.
In related news, Utica and Marcellus well activity in Ohio.
The Eagle Ford shale play has taken a massive hit as well. The region’s oil production has dropped 49,000 bpd from last month. The Eagle Ford peaked at 1,711,376 bpd back in March, but by July production will drop by 117,971 bpd.
Although the Niobrara region isn’t the strongest oil producer in the country, it also saw a sharp decrease of 17,000 bpd from the previous month. With a peak of 459,861 bpd in March, the 49,712 bpd fall by July is perhaps even harder hitting for the smaller area.
The lone wolf among the oil producers, the Permian shale play will actually see a 3,000 bpd increase month over month, and the EIA projects that the area will produce 2,059,851 bpd in July. However, production has been levelling out since the beginning of 2015. It is only a matter of time before the Permian caves to the trend and shows a decrease in production levels.
Natural gas hasn’t evaded the trend, either. The Haynesville and Marcellus areas will both show decreases month over month in natural gas production. The EIA report shows a dip of 26 million cubic feet per day (mmcf/d) for the Haynesville shale and a 28 mmcf/d decrease for the Marcellus region.
Natural gas production in the oil-focused areas dropped without exception. The only shining star amid natural gas producing shale plays is the Utica region. Contrary to the trend, the EIA reports a 42 mmcf/d increase month over month for the area, despite a stark decreased in legacy gas production that started in 2014.
To view the EIA’s full report, click here. See also: www.FrackCheckWV.net
>>>>>>>>>>>>>
Natural Gas Prices in Dollars per Thousand Cubic Feet (Million BTU)
The NYMEX price for natural gas today was $2.82. The average spot Henry Hub price for May of 2015 was $2.85. This price was over $13.00 in October of 2005 and over $12.00 in June of 2008, but shale gas drilling & fracking have seen a balloon in production since that time, although production is now slipping as described above.
Note: One report today out of western PA indicates a private lease royalty payment now down to $10 per acre per month with a single Marcellus well on a large drilling unit. These figures vary widely across the region. The royalty payments sink fast when the production declines and the price continues to remain low.

