 Sharp declines in well production typical in Ohio’s Utica Shale
From an Article by Bob Downing and Doug Livingston, Akron Beacon Journal, January 3, 2015
In the world of shale gas in Ohio, the top-producing wells aren’t king of the hill for long. Take the Tippens 6HS well, for example.
Located in Monroe County in southeastern Ohio, it produced more natural gas in the first quarter of 2014 than any other Utica Shale well in the state — some 1.117 billion cubic feet of the resource in 80 days, according to Ohio Department of Natural Resources records. That’s enough natural gas to fuel 12,000 houses for a year.
But the well that gushed 13,972 thousand cubic feet of natural gas per day in the first three months of 2014 saw daily production drop 41 percent in the second quarter to 8,180 thousand cubic feet per day and another 26 percent in the third quarter to 6,015 thousand cubic feet per day.
By autumn, the Tippens well was producing less than half the natural gas that it had during its peak output and slipped from No. 1 to No. 72. It went from being a stellar Ohio well to a good-producing well.
Similar drops are showing up in nearly all of Ohio’s horizontally drilled natural gas wells. Such numbers are evidence of what drillers call “production decline curves” — drop-offs over time. It’s a common (and expected) occurrence for shale wells, even in wells expected to produce for 30 years or more.
The bottom line: Shale wells produce the most in the first few years or, as evidenced in the sharply declining production rates in Ohio, their first few months. Understanding decline curves in the Utica Shale is an important and useful tool in decision-making for drilling companies. Sharp drops mean less money for drillers and less in royalty payments for landowners as wells age. Simply put, a decline curve is a graph of crude oil or natural gas production over time. As the products are extracted, production volumes trend downward. Hence, the term decline curve.
Analysis of Ohio’s decline curves is more complex. It won’t be possible to gauge fully how the Utica Shale in eastern Ohio compares with other shale formation in the United States until more time has passed and the Ohio Department of Natural Resources collects more data. Only five quarterly reports are now available.
Analysis of output
An analysis of Utica wells tapped in each of the first four quarters — from July 2013 through June 2014 — shows natural gas production had dropped 65 percent, said Dr. Jeffrey C. Dick, a professor and chair of the department of geology and environmental sciences at Youngstown State University and an expert on Utica Shale.
He estimated that Utica Shale production will drop 33 percent in the second year of a well’s life and another 22 percent in the third year. Decline is projected at another 17 percent in the fourth year, followed by 13 percent and 11 percent in the next two years, he said in a review that has circulated widely.
A graph of the annual declines resembles a swimming pool slide — unmistakably steep at first then gradually leveling off. Still, that initial Utica Shale production decline for the first year is “not too bad,” Dick said.
The Utica Shale production curve “is less of a drop than you might expect,” he said. It might “sound terrible, but it’s a pretty good number, actually.” Some production curves are as high as 80 percent in the first year, so what the Utica Shale is showing is “a fairly typical curve,” he said. Production drops of 80 percent have been found in the Haynesville Shale in Arkansas, Louisiana and Texas; parts of the Eagle Ford Shale in Texas; the Bakken Shale in North Dakota; and the Marcellus Shale in Pennsylvania, Dick said.
Determining decline rates is not easy, he said, because drilling companies have different approaches to production. Some want to draw down wells quickly, while others might restrict production to extend the lives of the wells or to wait until low prices rebound. Dick said that often the key for drillers who want to keep production totals high is for them to drill additional wells when production starts to decline significantly.
Important question
Drilling a Utica Shale well can cost from $6 million to $10 million, however, and an important question becomes: Can companies afford to keep drilling such wells?
Wells also can be hydraulically fractured, or fracked, multiple times to boost production. Even with the sharp decline curves, Ohio is not experiencing drops in total oil or natural gas production because additional wells are going online each quarter.
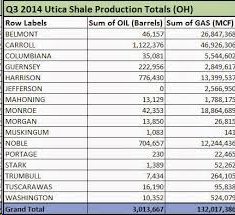
To date, Ohio has approved 1,735 Utica wells, of which 1,277 have been drilled. A total of 707 Utica wells are producing, according to ODNR figures. The most recent report, from third quarter 2014, for 717 wells showed total oil production of 3.013 million barrels and 132 billion cubic feet of natural gas. Both totals were significant jumps from the second quarter, when 504 wells were listed.
See also: www.FrackCheckWV.net
